BWS Fungi
Process
Survey Analysis
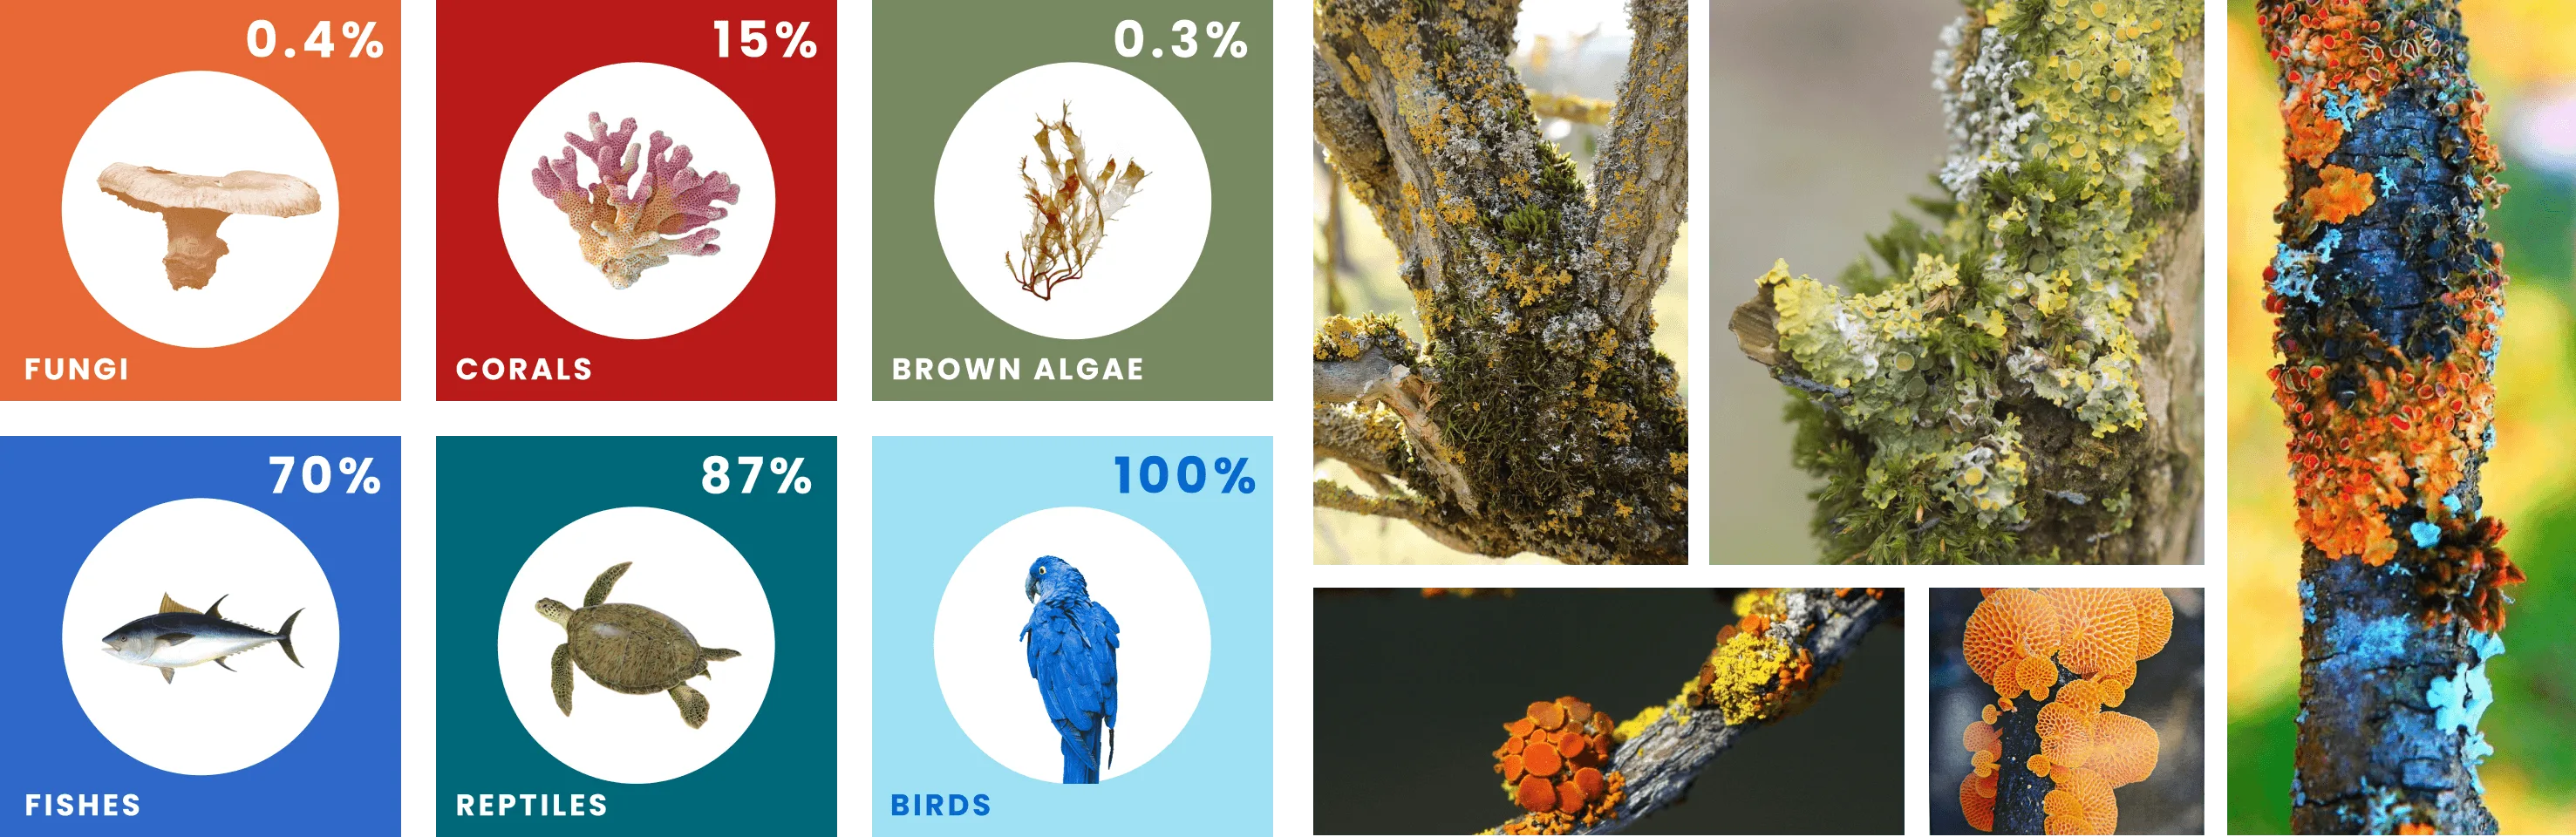
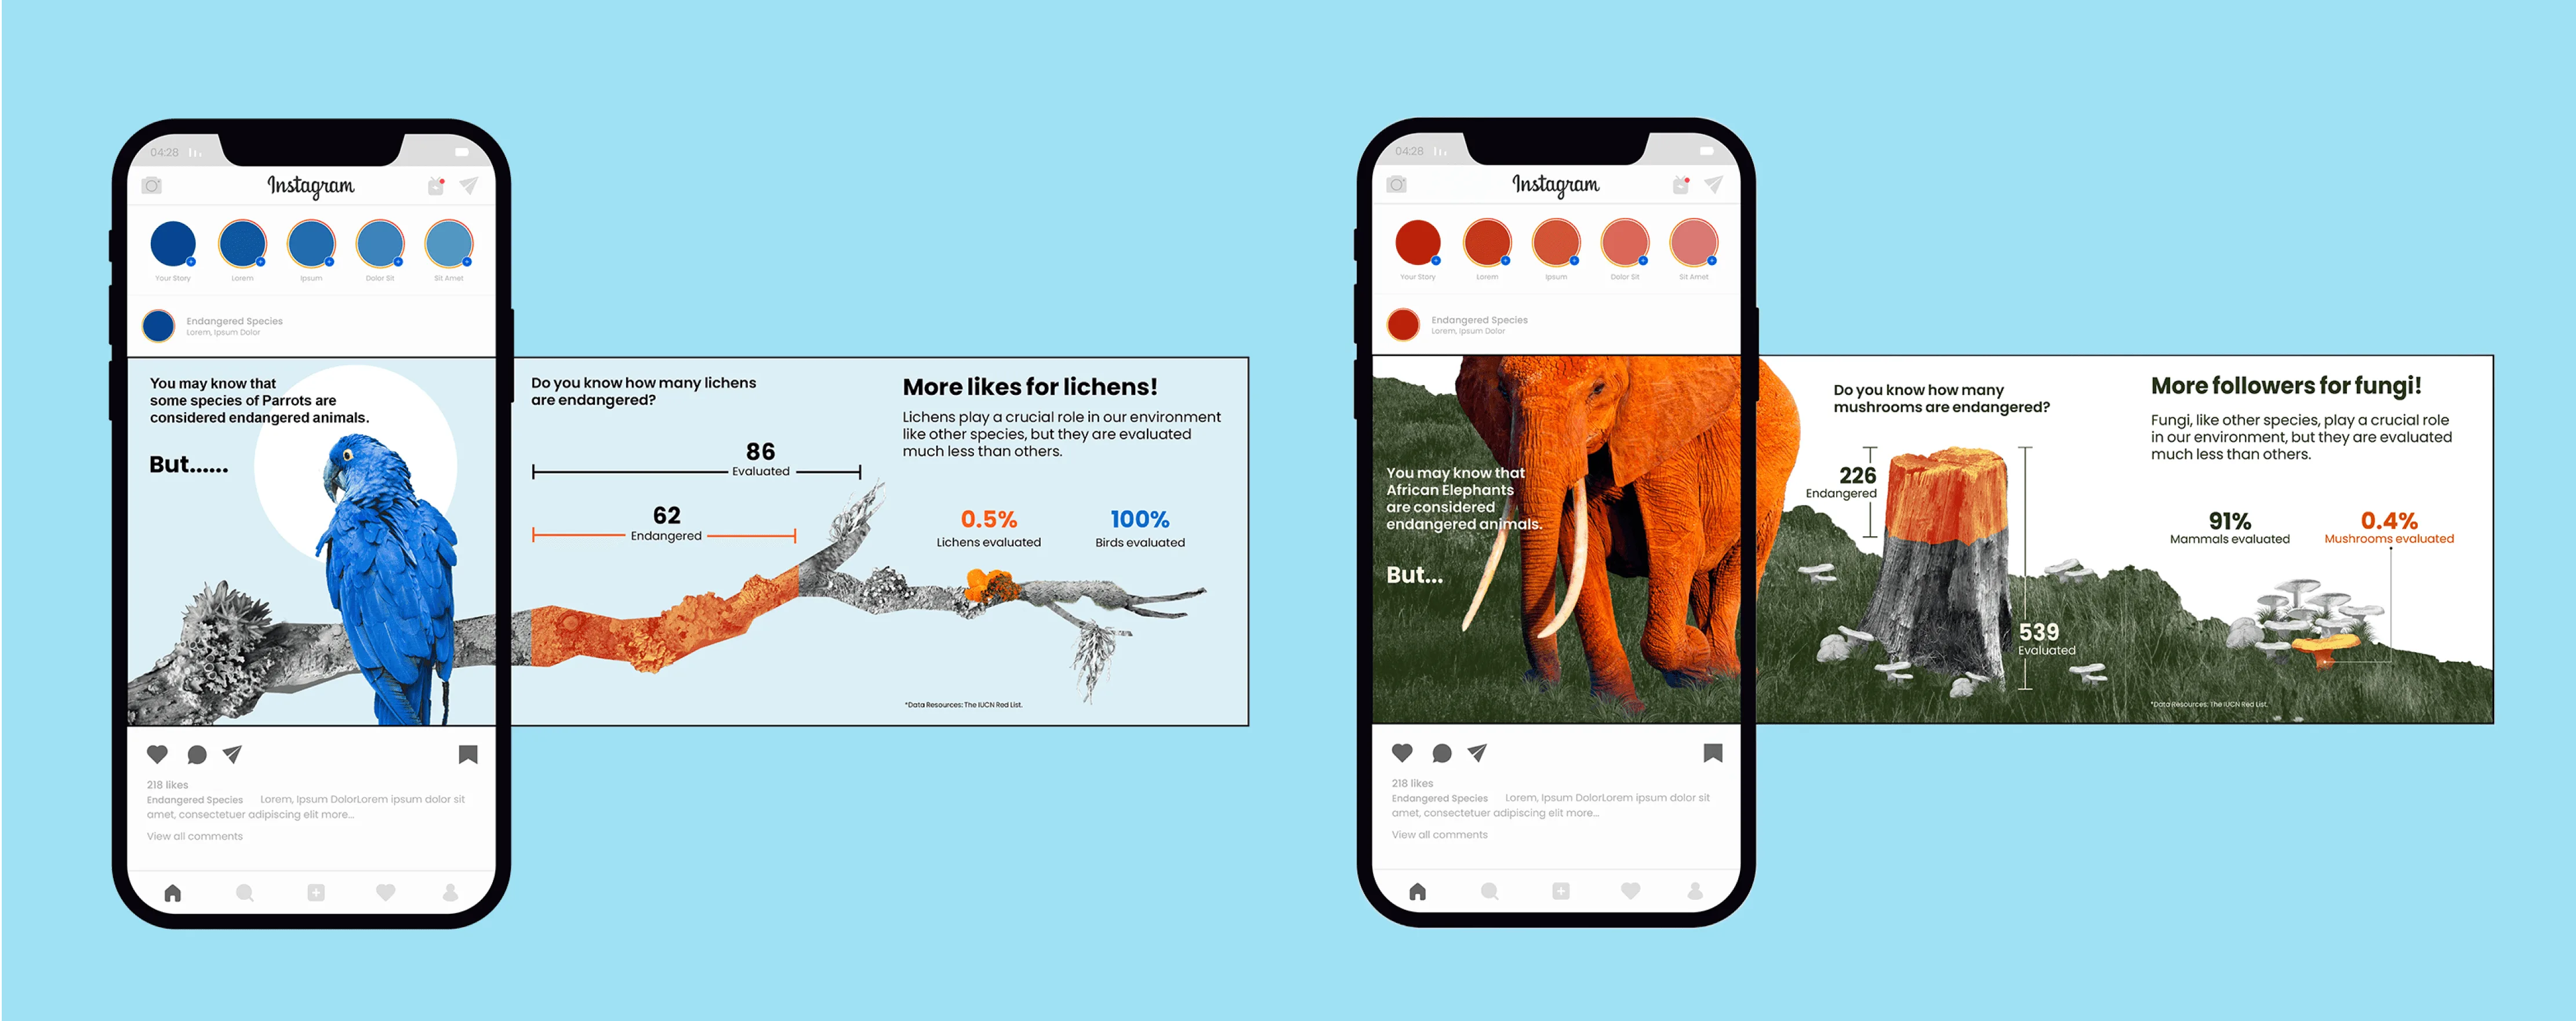
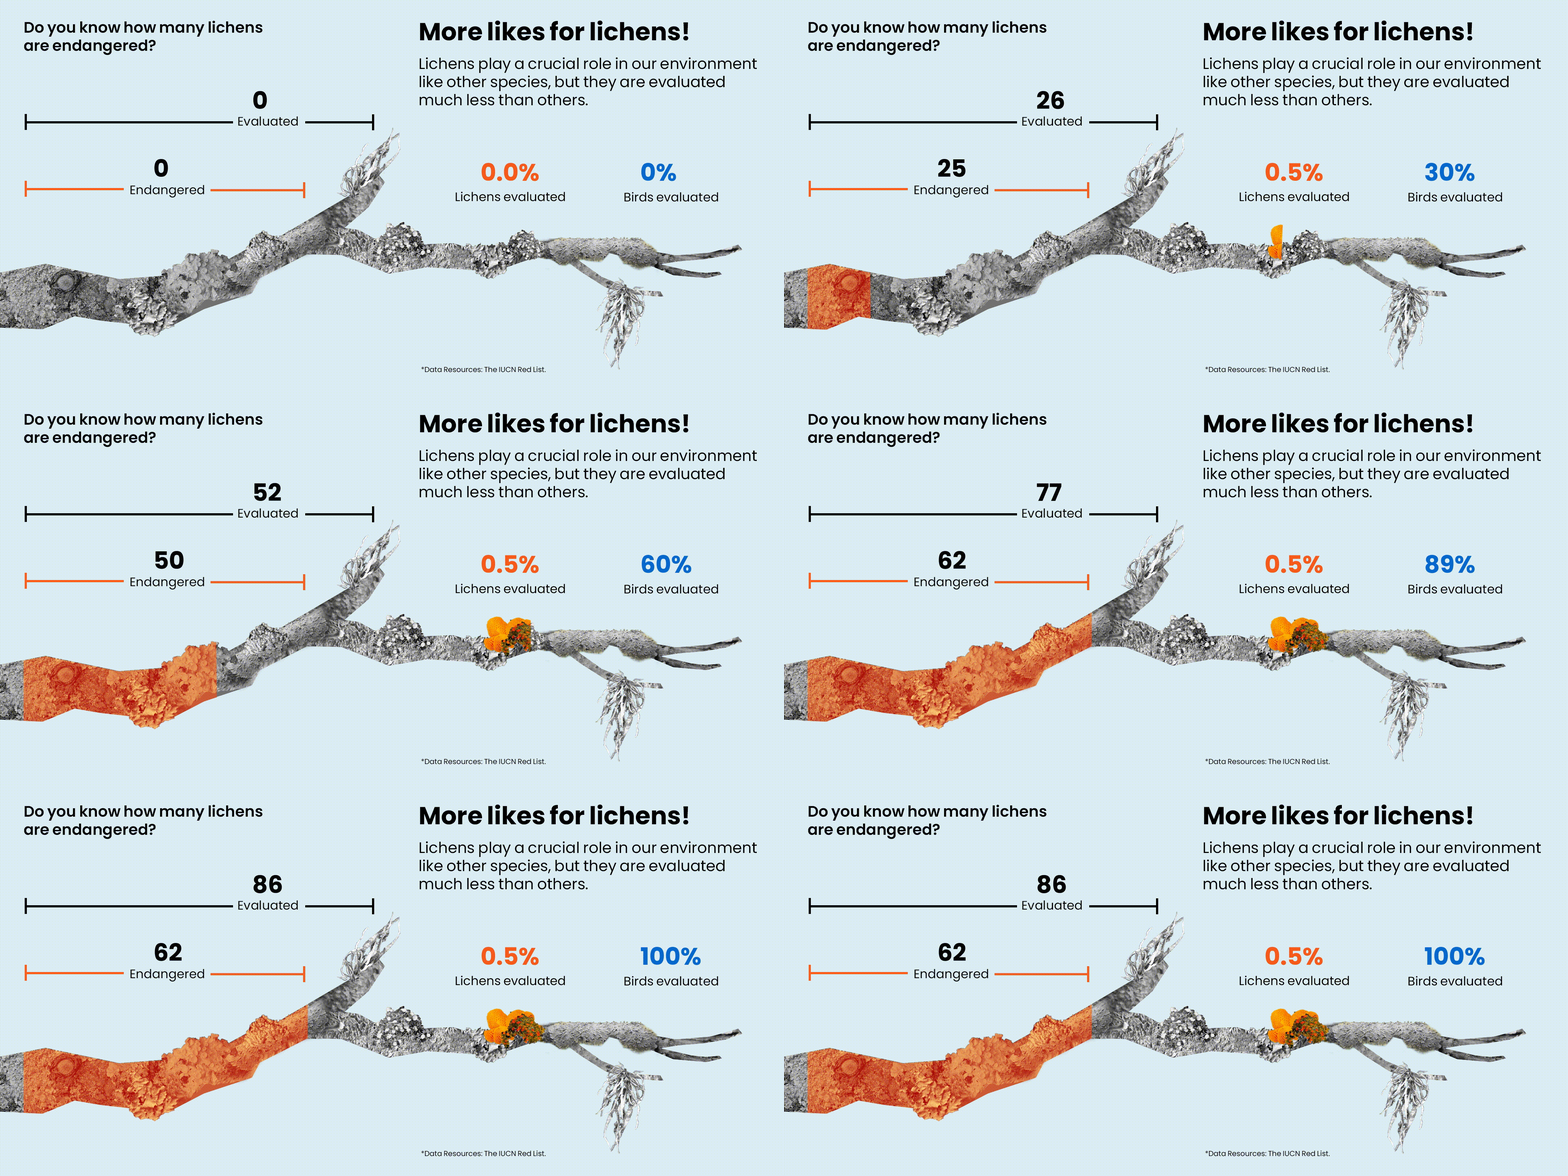
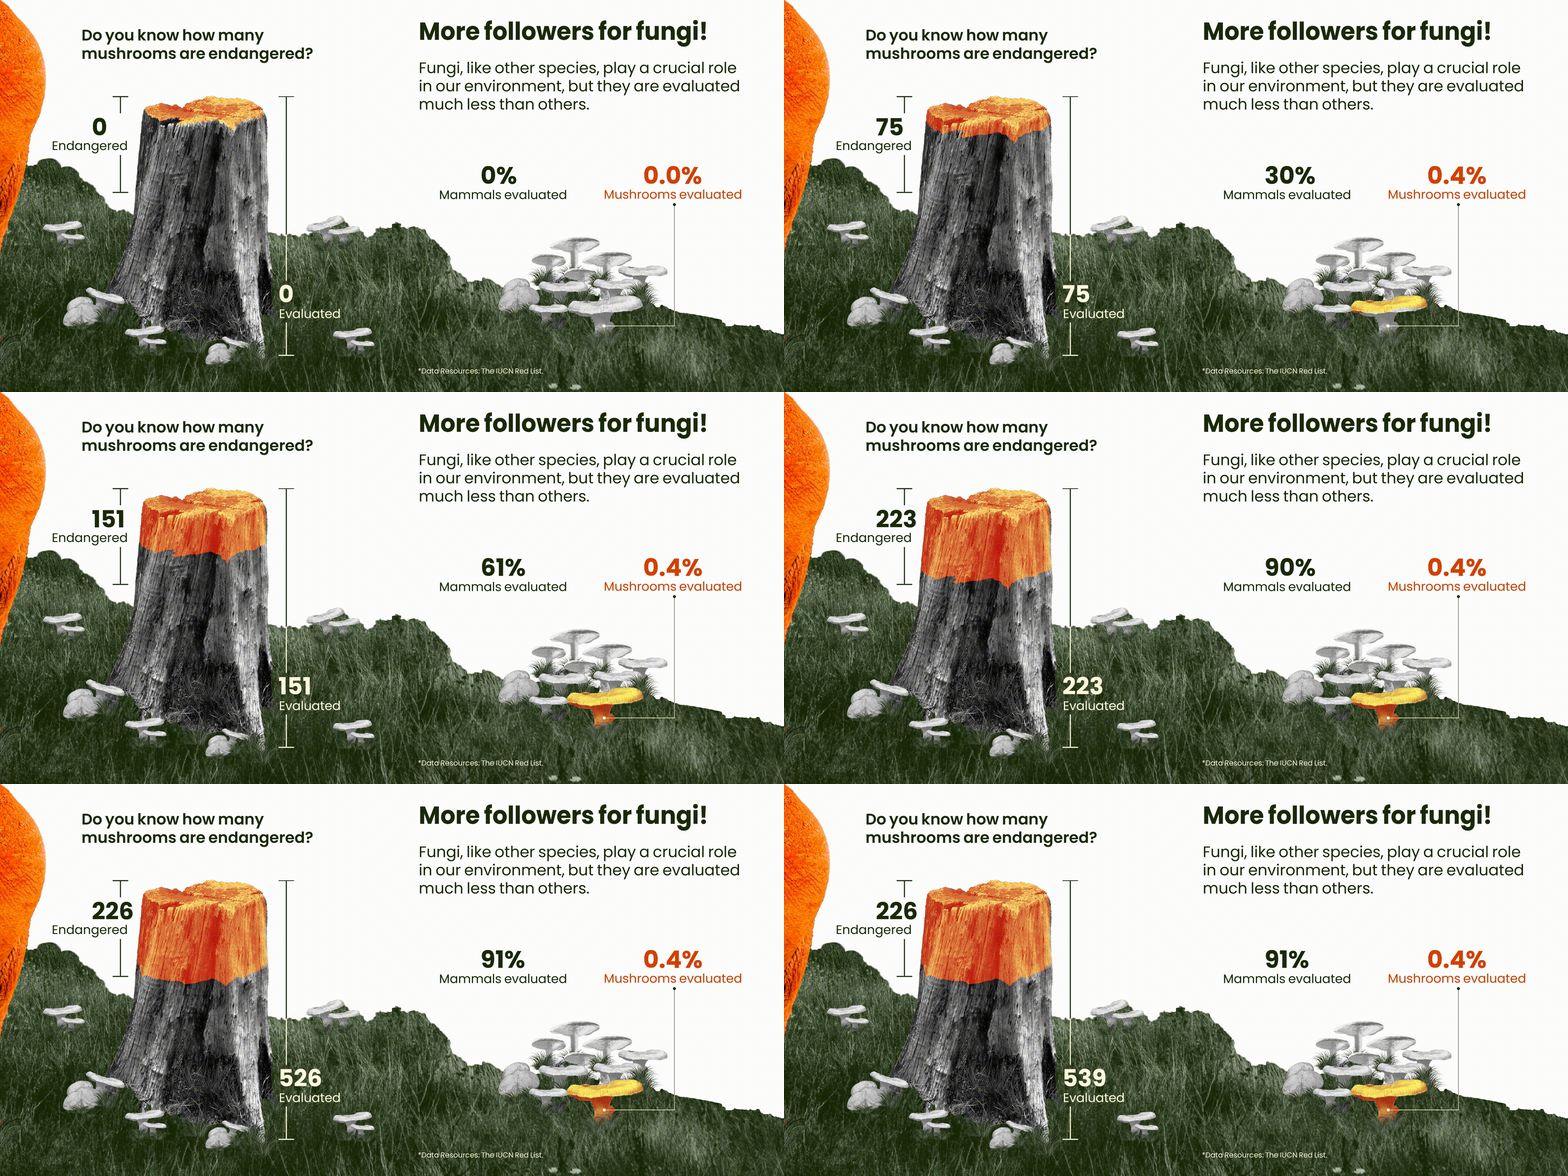
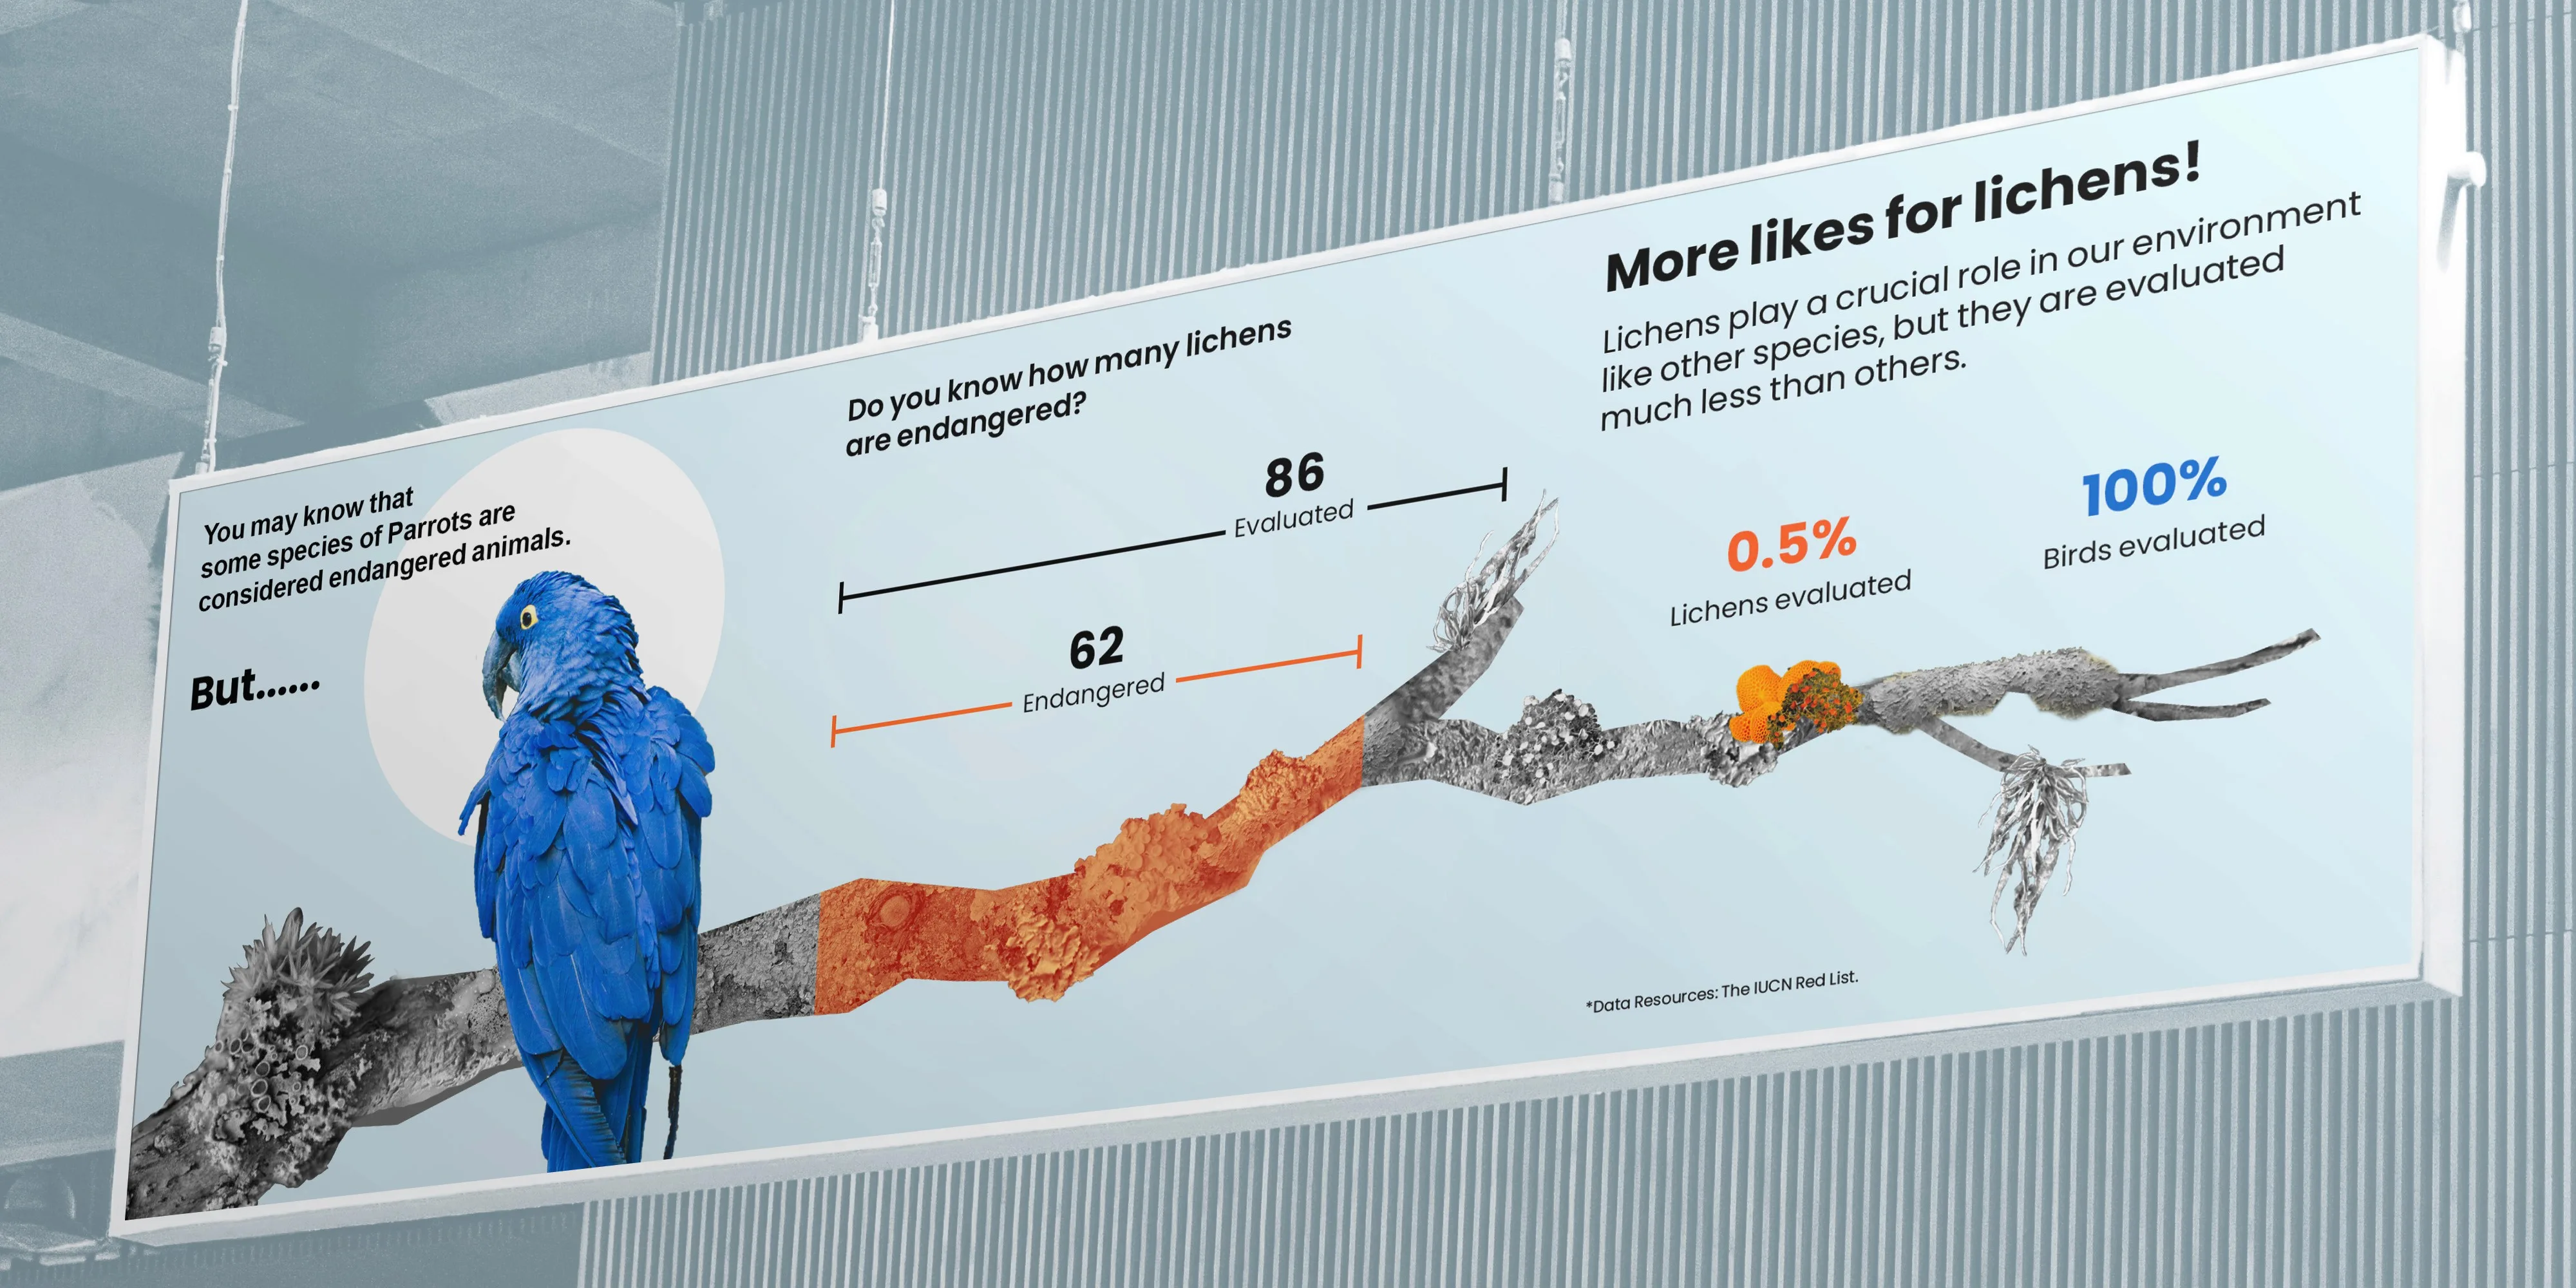
In this data visualization project, we focused on revealing the proportional differences between animals and fungi assessed in the IUCN Red List. Our aim is to draw more attention from the public and researchers to endangered fungi. Through data analysis, we found that by 2022, most mammals (91%) and birds (100%) had been assessed, whereas fungi like mushrooms and lichens had very low assessment rates, only 0.4% and 0.5%. This finding inspired us to delve deeper into this topic, particularly regarding non-animal species often overlooked in biodiversity conservation.
To achieve this, we set a narrative rhythm and hook text to attract and guide users through the data. We decided to use a single image rather than three different charts to present the data coherently and tell the story.
Visual Inspiration
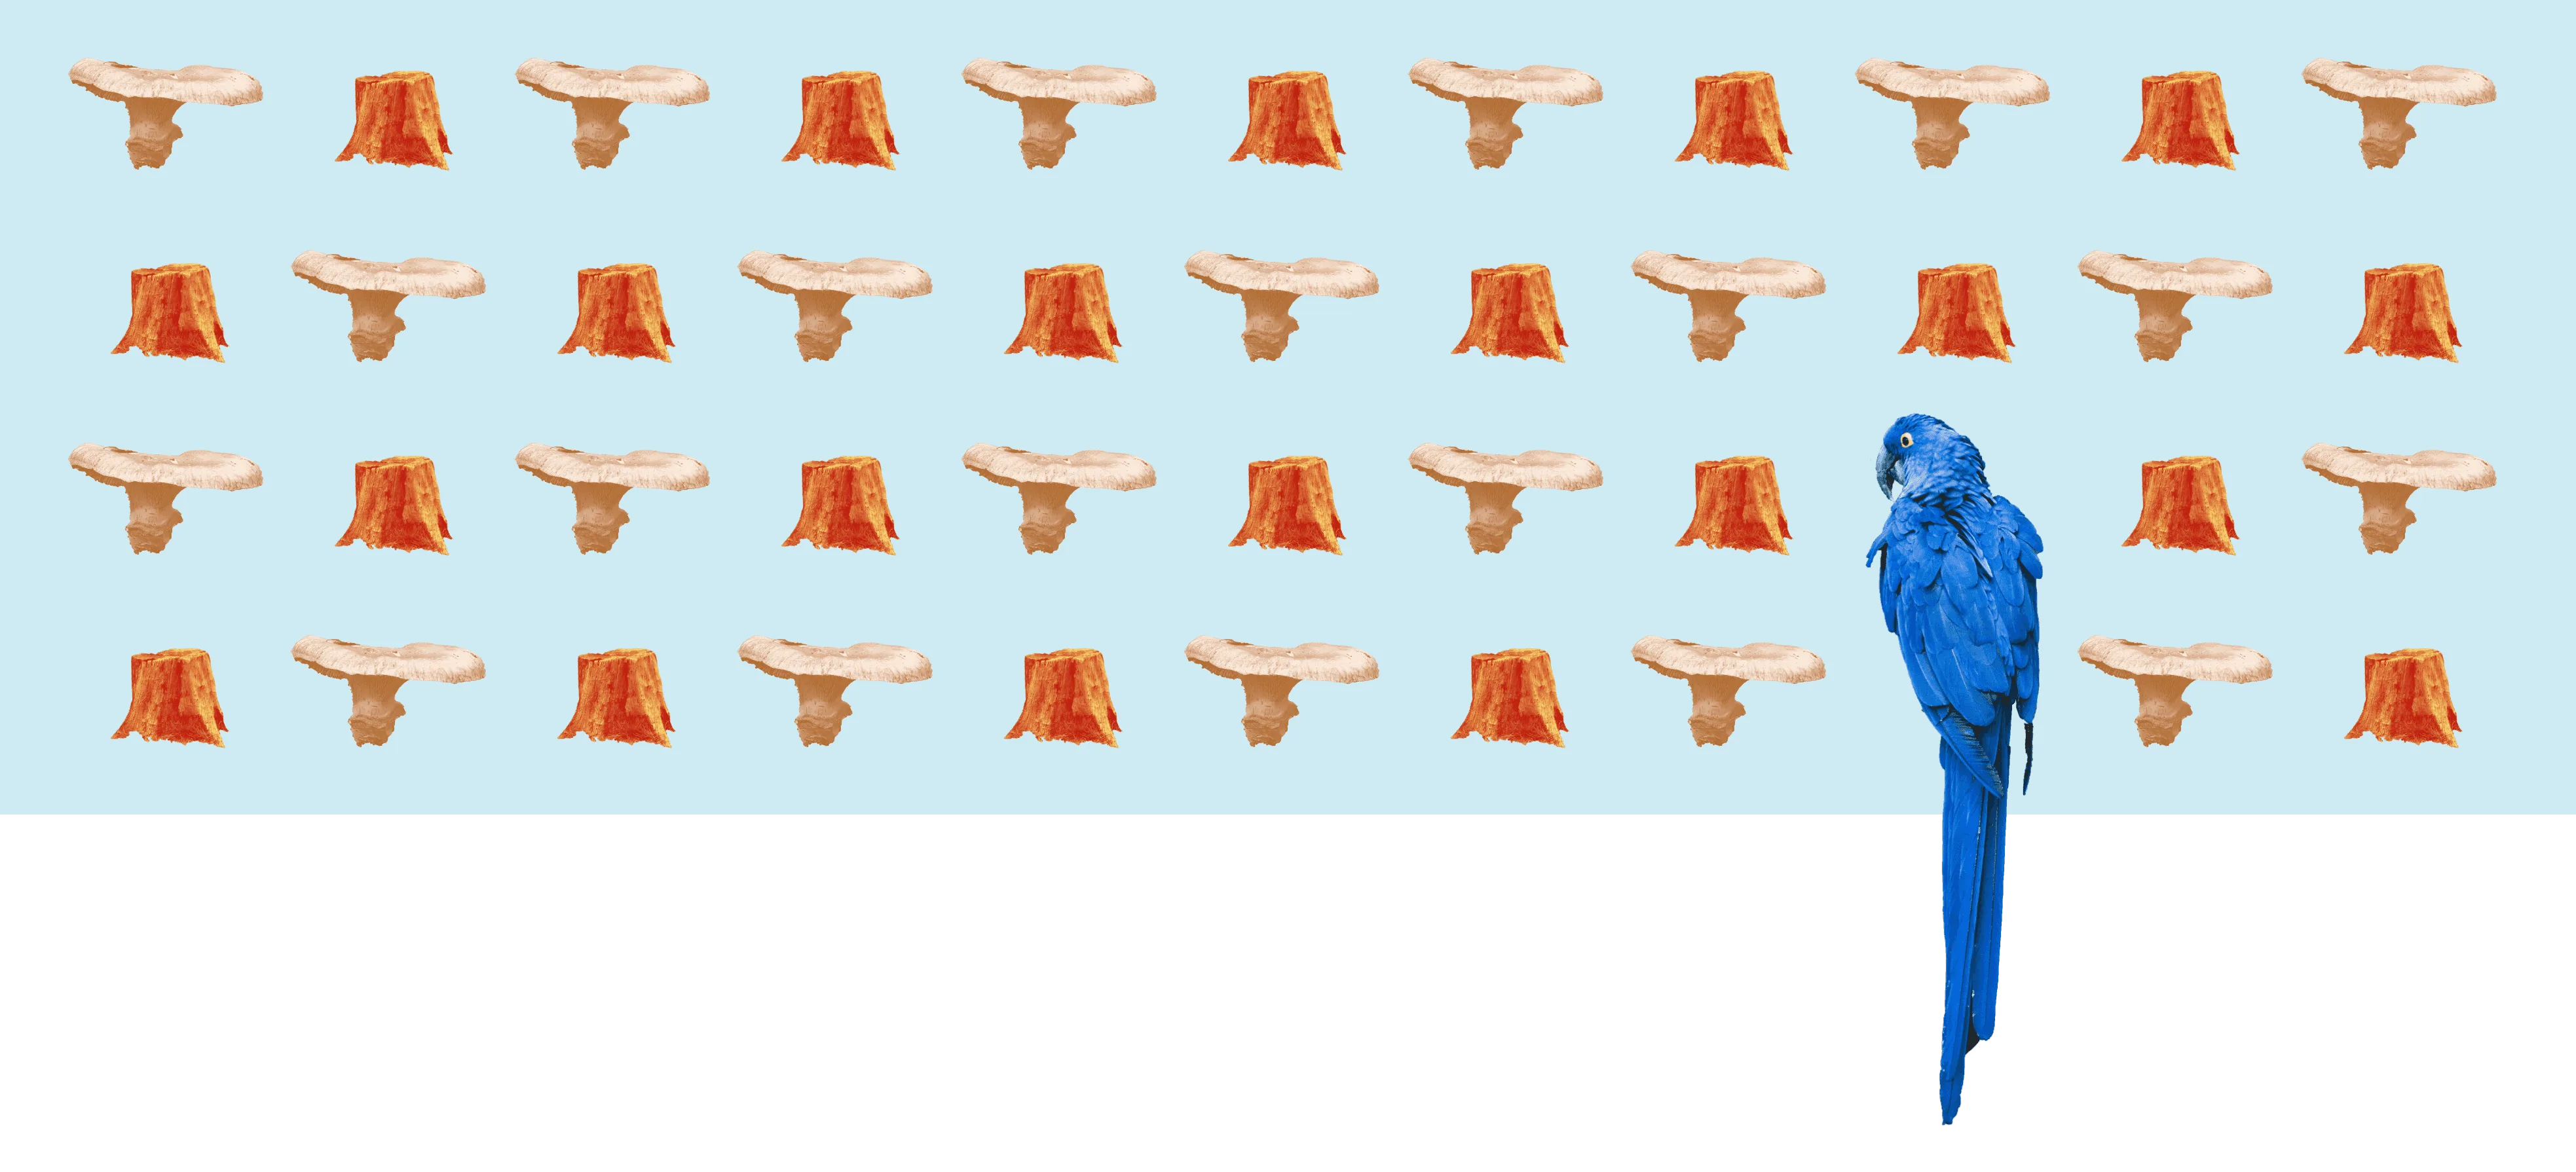
We found that the textures of fungi and plants have unique qualities that can provide richer contextual information for the data. Therefore, we decided to use collage as the primary visualization way. We combined data with images and added animations, making the visuals engaging and interesting while ensuring the format is simple enough for easy reading.
Outcome